
A critical issue
The rising tide of Vehicle-Off-Road (VOR) time is a critical issue for UK fleets. While planned VOR, such as scheduled servicing, MOTs, or upgrades, is a normal part of fleet management, unplanned VOR is a different beast entirely. It’s the breakdown that strands a service engineer mid-route. The collision that takes a delivery van out of service. The failed component that halts a logistics truck on a motorway hard shoulder. It’s unexpected, disruptive, and often expensive.
Unplanned VOR is typically measured in hours or days per vehicle, and when aggregated across a fleet, it can represent a significant loss of operational capacity. For businesses reliant on mobile service delivery, every hour a vehicle is off the road is an hour of lost productivity, missed appointments, and reputational risk.
According to the 2025 Insights Report from the 1link Service Network, average VOR time has increased by 25% over the past few years.
Before the pandemic, the average time a fleet vehicle spent in a workshop was 1.54 days. This figure has followed a consistent upward trajectory, peaking at 1.83 days in May 2023 and remaining volatile within a high band of 1.71–1.77 days through mid-2025.
This increase is not a temporary anomaly but rather the new normal, reflecting deeper systemic challenges. Nearly a quarter (24%) of UK fleets now identify VOR as a growing concern, up from 18% just a year ago.
Why is VOR increasing?
Four key forces are driving the increase in vehicle downtime:
The first is supply chain chaos, which continues to disrupt parts availability. Persistent shortages and unpredictable delivery schedules mean that even routine repairs can be delayed for days, leaving vehicles idle and service capacity reduced.
The second pressure is the skilled mechanic deficit. Demand for qualified technicians has outstripped supply, and workshops across the country are struggling to keep pace. Longer lead times for repairs are now commonplace, with complex jobs often waiting in queues that stretch far beyond acceptable limits.
Third, rising vehicle complexity is adding to the challenge. The widespread adoption of advanced driver assistance systems (ADAS), electric drivetrains, and specialist technologies has made repairs more intricate, requiring specialist knowledge, diagnostic equipment, and extended service hours. What once took a few hours can now take days.
Finally, ageing fleets are compounding the problem. Older vehicles demand more frequent maintenance, consume more parts, and are more prone to breakdowns.
Each of these forces represents an external pressure beyond the direct control of fleet managers. Combined, they create a perfect storm of operational challenges, testing resilience, planning, and leadership across the sector.
Are you missing the signals?
Many fleets have vehicle health data - the problem is it's trapped in disconnected systems.
Telematics sits in one platform, workshop records in another, driver behaviour in a third. Even when data exists, it's rarely in a format that enables quick decisions. The result? Fleet managers are data-rich but insight-poor, unable to spot the patterns that predict failures before they happen.
Studies suggest that fleets could cut unplanned downtime by as much as 60% by monitoring and acting on predictive signals consistently. Yet one in four fleet managers still don't review vehicle health data daily - not because they're ignoring it, but because extracting meaningful insight from fragmented systems is too time-consuming to sustain.
The critical signals to prioritise:
Not all data points matter equally. Start by tracking these high-impact signals:
- Predictive fault codesCertain diagnostic trouble codes consistently appear 2–4 weeks before major failures. Identify which codes in your fleet precede expensive breakdowns - these become your early warning triggers.
- Failure patterns by vehicle type/group/location/jobWhich makes, models, or age bands show elevated VOR rates? Pattern recognition across vehicle segments reveals whether you have procurement issues, maintenance schedule problems, or simply vehicles reaching end-of-life.
- Workshop turnaround time trendsIf average repair duration is increasing, it signals parts availability issues, workshop capacity constraints, or rising vehicle complexity. Track this by repair type to identify specific bottlenecks.
- Route and utilisation correlationDo certain routes or operating patterns accelerate wear? High-density urban routes may cause different failure modes than motorway operations. Understanding this allows targeted preventive interventions.
- Driver behaviour impact on maintenance costsWhich drivers generate disproportionate maintenance expenses? Correlating harsh braking events, excessive idling, or speeding incidents with subsequent repair costs identifies where coaching delivers ROI.
When data exists but isn't leveraged, every preventable breakdown is a self-inflicted wound. The shift from external challenges to internal control starts here - connecting your data and focusing on the signals that matter.
The business impact of VOR
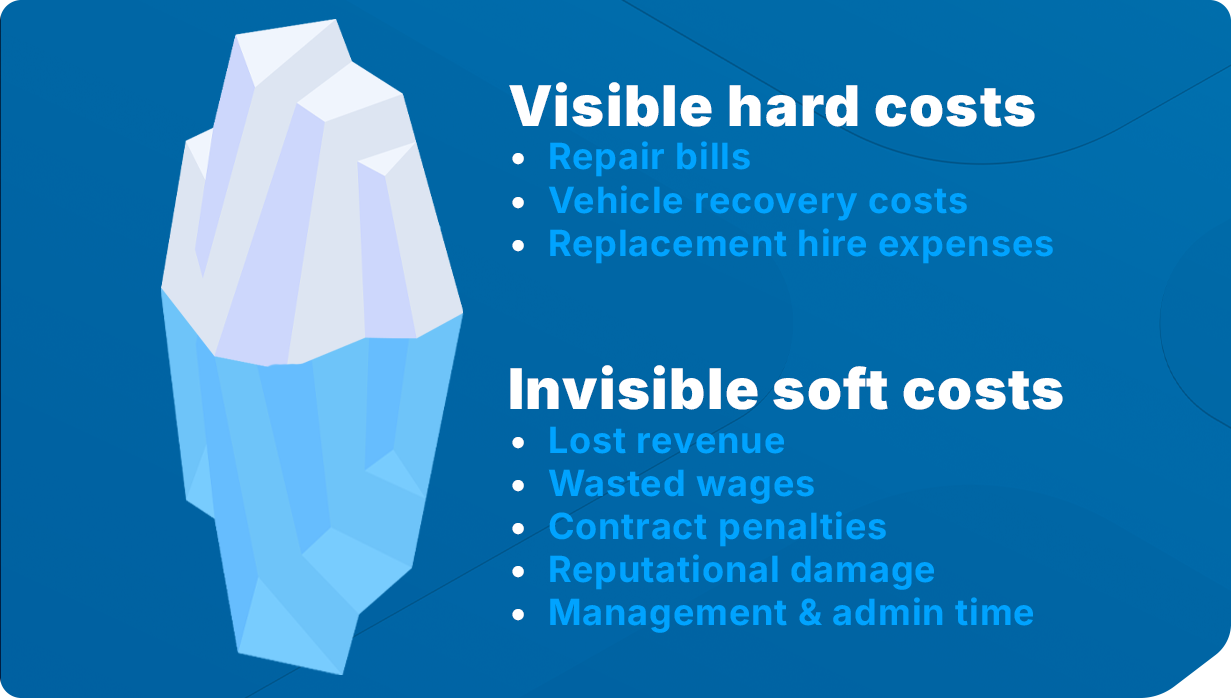
The visible repair bill is only the tip of the iceberg when it comes to the true cost of vehicle downtime where the majority of costs are unseen and often unaccounted for in traditional budgeting.
Above the waterline are hard costs such as the average repair bill (£1,772), vehicle recovery costs, replacement hire expenses, and the regular repair and maintenance budget.
However, lurking below the surface are hidden "soft" costs that can be even more damaging: lost revenue (often exceeding £700 per day), wasted wages, contract penalties, driver frustration, reputational damage, and of course, not forgetting all that additional management and admin time.
To illustrate the real financial impact, consider a typical scenario: the average repair bill is £1,772, average downtime is 1.72 days, and lost productivity costs £700 per day. The true immediate cost is therefore £1,772 plus lost productivity (1.72 × £700), totalling approximately £2,976. And this calculation doesn’t account for any recovery costs, "missed delivery" penalties or the longer-term damage to your company’s reputation.
It’s clear that vehicle downtime isn’t just a minor inconvenience – it’s a significant threat to profitability and operational stability.
Minimising VOR: Your 4-pillar framework
Pillar 1: Foundational practices
The first pillar, foundational practices, is about mastering the non-negotiables of fleet management by digitising manual processes and automating key compliance aspects. This frees fleet management capacity from the burden of admin to focus on strategic analysis. Digital daily vehicle checks, with automated defect reporting and escalation, dynamic maintenance scheduling based in usage patterns, and real time defect tracking transform routine compliance from a daily checkbox exercises into an early warning system. This foundational layer doesn't just prevent breakdowns – it generates the clean, actionable data that powers predictive analytics in Pillar 2 and informed driver coaching in Pillar 3.
Pillar 2: Digital transformation
Digital Transformation focuses on the power of data to predict and prevent issues rather than simply reacting to them. Most fleets already have telematics, maintenance management systems, and driver behaviour platforms. The challenge isn't data availability – it's achieving full connectivity across fleet data systems and extracting predictive signals you can act on.
The critical questions to answer are:
- Which fault codes consistently precede breakdowns within 2–4 weeks?
- Which vehicle cohorts show accelerated wear patterns?
- Which routes or driver behaviours correlate with higher VOR rates?
By leveraging software like FleetCheck, fleet managers can integrate technology into everyday operations to answer these questions, gaining real-time insights into vehicle health and performance that can unlock up to a 60% reduction in unplanned downtime - not by collecting more data, but by making better decisions with the data you already have.
Pillar 3: The human element
The third pillar recognises that drivers are not just operators but asset custodians, playing a central role in building a resilient fleet. When drivers take pride in their work and see their vehicles as more than just lumps of metal to get from A to B, everything changes - from how they respond to warning lights to how they report defects.
Building this sense of ownership starts with culture. Companies that invest in driver wellbeing, provide quality vehicles with proper equipment, and genuinely listen to driver feedback create an environment where drivers want to look after their assets. It's about mutual respect: if you show drivers their work matters and give them the tools to do it properly, they'll reciprocate by treating vehicles with care.
Training plays a crucial supporting role here, but it needs to be relevant and personalised rather than generic box-ticking. Use telematics to identify specific behaviour patterns - perhaps the 20% of drivers generating 80% of harsh braking events or excessive idling - and implement targeted interventions based on actual data. Eco-driving and defensive driving programmes, when tailored to individual needs, empower drivers to take genuine ownership of vehicle care and can lead to lower SMR costs and fewer incidents.
When drivers feel valued and equipped with the right knowledge, they become your first line of defence against VOR - spotting issues early, reporting defects promptly, and operating vehicles in ways that extend asset life.
Pillar 4: Strategic asset management
The final pillar challenges one of fleet management's most persistent assumptions: that vehicles should be replaced based on blanket age or mileage thresholds. Strategic asset management is about using real data to determine when each vehicle genuinely needs replacing.
Total Cost of Ownership (TCO) analysis provides the framework, but only when fed with actual performance data. Track maintenance costs, VOR frequency, and repair patterns at the individual vehicle level. You might find that a five-year-old van with proper maintenance history significantly outperforms a two-year-old vehicle poorly specified for its operating conditions.
The assumption that newer vehicles are inherently more reliable doesn't always hold true. Real-world data often reveals that reliability depends more on specification, operating environment, and maintenance quality than age alone. By adopting this data-driven approach, you avoid premature disposal of reliable assets while identifying genuinely problematic vehicles earlier - maximising asset value based on actual performance rather than predetermined assumptions.
| Pillar | Principle | Key actions | Outcome |
|---|---|---|---|
|
1
Foundational practices
|
Master the non-negotiables | Daily checks, PM schedule | First line of defence |
|
2
Digital transformation
|
Predict, not just react | Telematics, digital inspections | 60% less unplanned downtime |
|
3
The human element
|
Drivers as custodians | Training, coaching | Lower SMR, fewer accidents |
|
4
Strategic asset management
|
Lifecycle focus | TCO analysis, replacement cycles | Optimised spend, max value |
Take control of your VOR performance
The external pressures driving VOR increases aren't going away: supply chain disruption, mechanic shortages, vehicle complexity, and aging fleets. But the internal levers are entirely within your control.
Start by auditing your current VOR data:
- What's your average VOR rate by vehicle type and age?
- Where are the patterns? Which routes, drivers, or vehicle segments show elevated rates?
- Are you monitoring predictive signals or just reacting to breakdowns?
Then prioritise interventions based on your specific vulnerabilities. The four-pillar framework isn't a sequential checklist - it's a diagnostic tool to identify where your operation needs the most attention.
Leading fleets are already seeing measurable results:
London Borough of Tower Hamlets eliminated unexpected VOR surprises across their 350-vehicle fleet using FleetCheck's dynamic maintenance and service scheduling as their centralised planning system. Automated alerts replaced spreadsheets, ensuring proactive maintenance and seamless cross-team collaboration.
Adrian White Building Supplies moved from reactive firefighting to predictive maintenance with FleetCheck. Since implementation, they've reduced unplanned VOR to near-zero levels through automated scheduling and proactive defect tracking. As Fleet Manager Wyatt Tait notes: “I can clearly track what's done and what's pending, keeping faulty vehicles off the road before they become problems”.