
Most fleet managers are sitting on more useful data than ever before.
The telematics platform, the fuel cards, the maintenance system, the licence checks - between them they tell a detailed story about how the fleet is performing, where the risks are, and what it's costing the business. The problem is that the story is spread across five different systems, and nobody has time to go and find all the chapters.
That fragmentation is what stops good data becoming good decisions. It's not a lack of information; it's a lack of a single place where it comes together clearly enough to act on.
That's what good management reporting is supposed to provide. Not more data, and not more admin, a clearer view of what you already have. Fleet managers who get this right don't just run vehicles efficiently. They walk into budget conversations with evidence, get investment approved, and when things go wrong, they're in a demonstrably strong position.
This piece covers what to report, how to structure it for different audiences, and how to make it work harder for you and for the business.
What should a fleet management report include?
Effective fleet reporting covers four distinct areas:
- Safety
- Performance
- Efficiency
- Costs
Many fleets report on one or two of these in isolation. The most valuable reporting joins them up, because the connections between them are where the real insight lives.
Fleet safety reporting
Safety reporting is not just about recording collisions after they happen. The most useful safety data is leading rather than lagging and it tells you where risk is building before an incident occurs.
Driver behaviour is the most important leading indicator available to most fleets. Telematics data showing speeding, harsh braking, rapid acceleration, and phone use gives a clear picture of which drivers are presenting the highest risk. This data should be reported regularly, ideally weekly, and tracked against individual driver histories rather than just fleet-wide averages. A driver whose harsh braking score has doubled in three months needs attention – waiting until they have a collision is too late.
Beyond telematics, safety reporting should cover licence check compliance (including the frequency and outcomes of DVLA checks), driver medical declarations, and near miss and incident reporting. Near misses are particularly valuable: a culture that captures and reviews them is a culture that catches systemic problems before they escalate.
Vehicle safety reporting should track defect rates and resolution times from daily walkaround checks, time-to-repair for reported defects, and MOT and periodic maintenance inspection (PMI) pass rates. A fleet with a rising first-time MOT failure rate has a maintenance problem. A fleet where defect reports sit unresolved for days has a process problem. Both show up in the data before they turn into incidents.
Compliance dates for MOT renewals, service intervals, insurance, tax, operator licence renewal, and driver CPC should be tracked with sufficient advance notice to act on them. A dashboard showing the number of vehicles and drivers with compliance events due in the next 30, 60, and 90 days is worth more than any retrospective log.
Most safety reporting counts incidents. The more useful question is whether they share a pattern - time of day, day of week, route, vehicle type, driver tenure. These correlations don't appear in a simple incident log but they're often hiding in plain sight when fleet data is looked at over time. Finding that pattern is the difference between managing safety reactively and getting ahead of it.
Fleet performance reporting: availability, utilisation and uptime
Performance reporting answers the question: is the fleet doing its job effectively?
For fleets where vehicles are central to service delivery, such as those in logistics, field service, construction, utilities, vehicle availability, and uptime is the most critical metric. Every vehicle off the road has an operational cost. Tracking unplanned vehicle off road time (VOR) separately from planned maintenance downtime reveals whether your maintenance strategy is working. Persistent unplanned VOR suggests either poor maintenance quality or vehicles being pushed beyond their appropriate cycle.
Utilisation rates reveal whether the fleet is the right size. Vehicles consistently running at low mileage are candidates for disposal; chronic over-utilisation creates wear, cost, and driver fatigue. Reported alongside job completion rates and service level metrics, utilisation data tells a coherent story about fleet performance that goes beyond vehicle management alone.
Driver performance metrics such as jobs completed per day, on-time delivery rates, and route adherence belong in fleet performance reporting too, particularly where driver behaviour links directly to customer outcomes.
Efficiency reporting: fuel, routes and total cost of ownership
Efficiency reporting sits between performance and cost. It tells you how effectively the fleet is using its resources.
Fuel consumption and cost per mile are the bedrock of efficiency reporting. Tracking these at vehicle and driver level, and benchmarking against manufacturer specifications and peer vehicles, quickly identifies outliers. A van consistently achieving significantly worse fuel economy than identical vehicles on similar routes either has a mechanical problem or is being driven poorly – or both.
Route efficiency reporting, where telematics or route planning data is available, can reveal unnecessary mileage, excessive idle time, or routes that are consistently running over their planned time. Idle time in particular is worth tracking – for diesel fleets it represents direct fuel waste with no productive output.
For fleets managing grey fleet – employees using private vehicles for business journeys – efficiency reporting should include business mileage claims validation. Without oversight, grey fleet mileage tends to be over-claimed and under-managed, creating both cost and compliance exposure.
Tyre management is often under-reported but consistently significant. Tyres are among the highest-recurring maintenance costs for commercial fleets, and premature replacement because of harsh driving or incorrect inflation is avoidable. Tracking tyre spend per vehicle per year, alongside driver behaviour data, usually reveals clear patterns.
Fleet cost reporting: from spend tracking to TCO
Cost reporting should give a complete, accurate picture of what the fleet costs to run and not just what the accounts department sees.
The most useful framework is total cost of ownership (TCO) by vehicle.
- Acquisition or lease cost
- Fuel
- Maintenance and repair
- Insurance
- Tyres
- Fines and penalty charges
- Any downtime costs (including replacement hire)
Reported at vehicle level and aggregated to fleet level, this allows genuine comparisons between vehicles, vehicle types, and funding methods to drive better procurement decisions.
Cost variance reporting – tracking actual spend against budget by category, month by month – catches problems early. An unexpected spike in maintenance costs is much easier to address in the month it appears than after it has run for a quarter. A steady upward trend in insurance costs across the fleet should prompt a review of claims history and driver behaviour before the next renewal.
Where the fleet supports revenue-generating operations, cost per mile or cost per delivery should be calculated and tracked over time. This turns fleet cost data from a back-office function into a commercial input.
How reporting benefits the fleet manager
Good reporting isn't just good for the business. It's good for the fleet manager specifically, and it's worth being direct about why.
The most immediate benefit is protection.
If a serious incident occurs, such as a driver collision, a vehicle failure, or an HSE investigation, the fleet manager who can produce documented evidence of systematic oversight is in a fundamentally different position from one who cannot. Reporting creates the audit trail that demonstrates professional management, and in the worst cases, it's the difference between a defensible position and a personal liability.
The second benefit is authority.
Fleet managers will struggle to get resource, headcount or investment approved if they can't make a compelling financial case. A fleet manager who can walk into a discussion about replacing a vehicle with data showing its maintenance cost per mile is three times the fleet average, its unplanned downtime has cost the business two weeks of productive capacity this year, and its repair-to-replacement cost calculation makes early disposal financially straightforward is a fleet manager who gets decisions made quickly. Data is influence.
The third benefit is time.
It seems counterintuitive – producing reports takes time – but systematic reporting, particularly when supported by fleet management software, reduces the time spent firefighting. Problems that are caught early are cheaper and quicker to resolve than crises. Compliance management through automated alerts means less time chasing renewal dates manually. Good fleet data means fewer conversations trying to reconstruct what happened or why.
Finally, reporting supports career development.
Fleet managers who demonstrate strategic thinking – who can connect fleet data to business outcomes and present it in terms that the wider business understands – are more visible, more valued, and more promotable than those who operate the fleet competently but invisibly.
What to report to the board
Board-level reporting is a different exercise from operational reporting, and conflating the two is a common mistake. Boards need context and consequence, not detail. They need to understand what the fleet is costing, what risks it carries, and whether it is being managed effectively – not how many vehicles had tyre replacements last month.
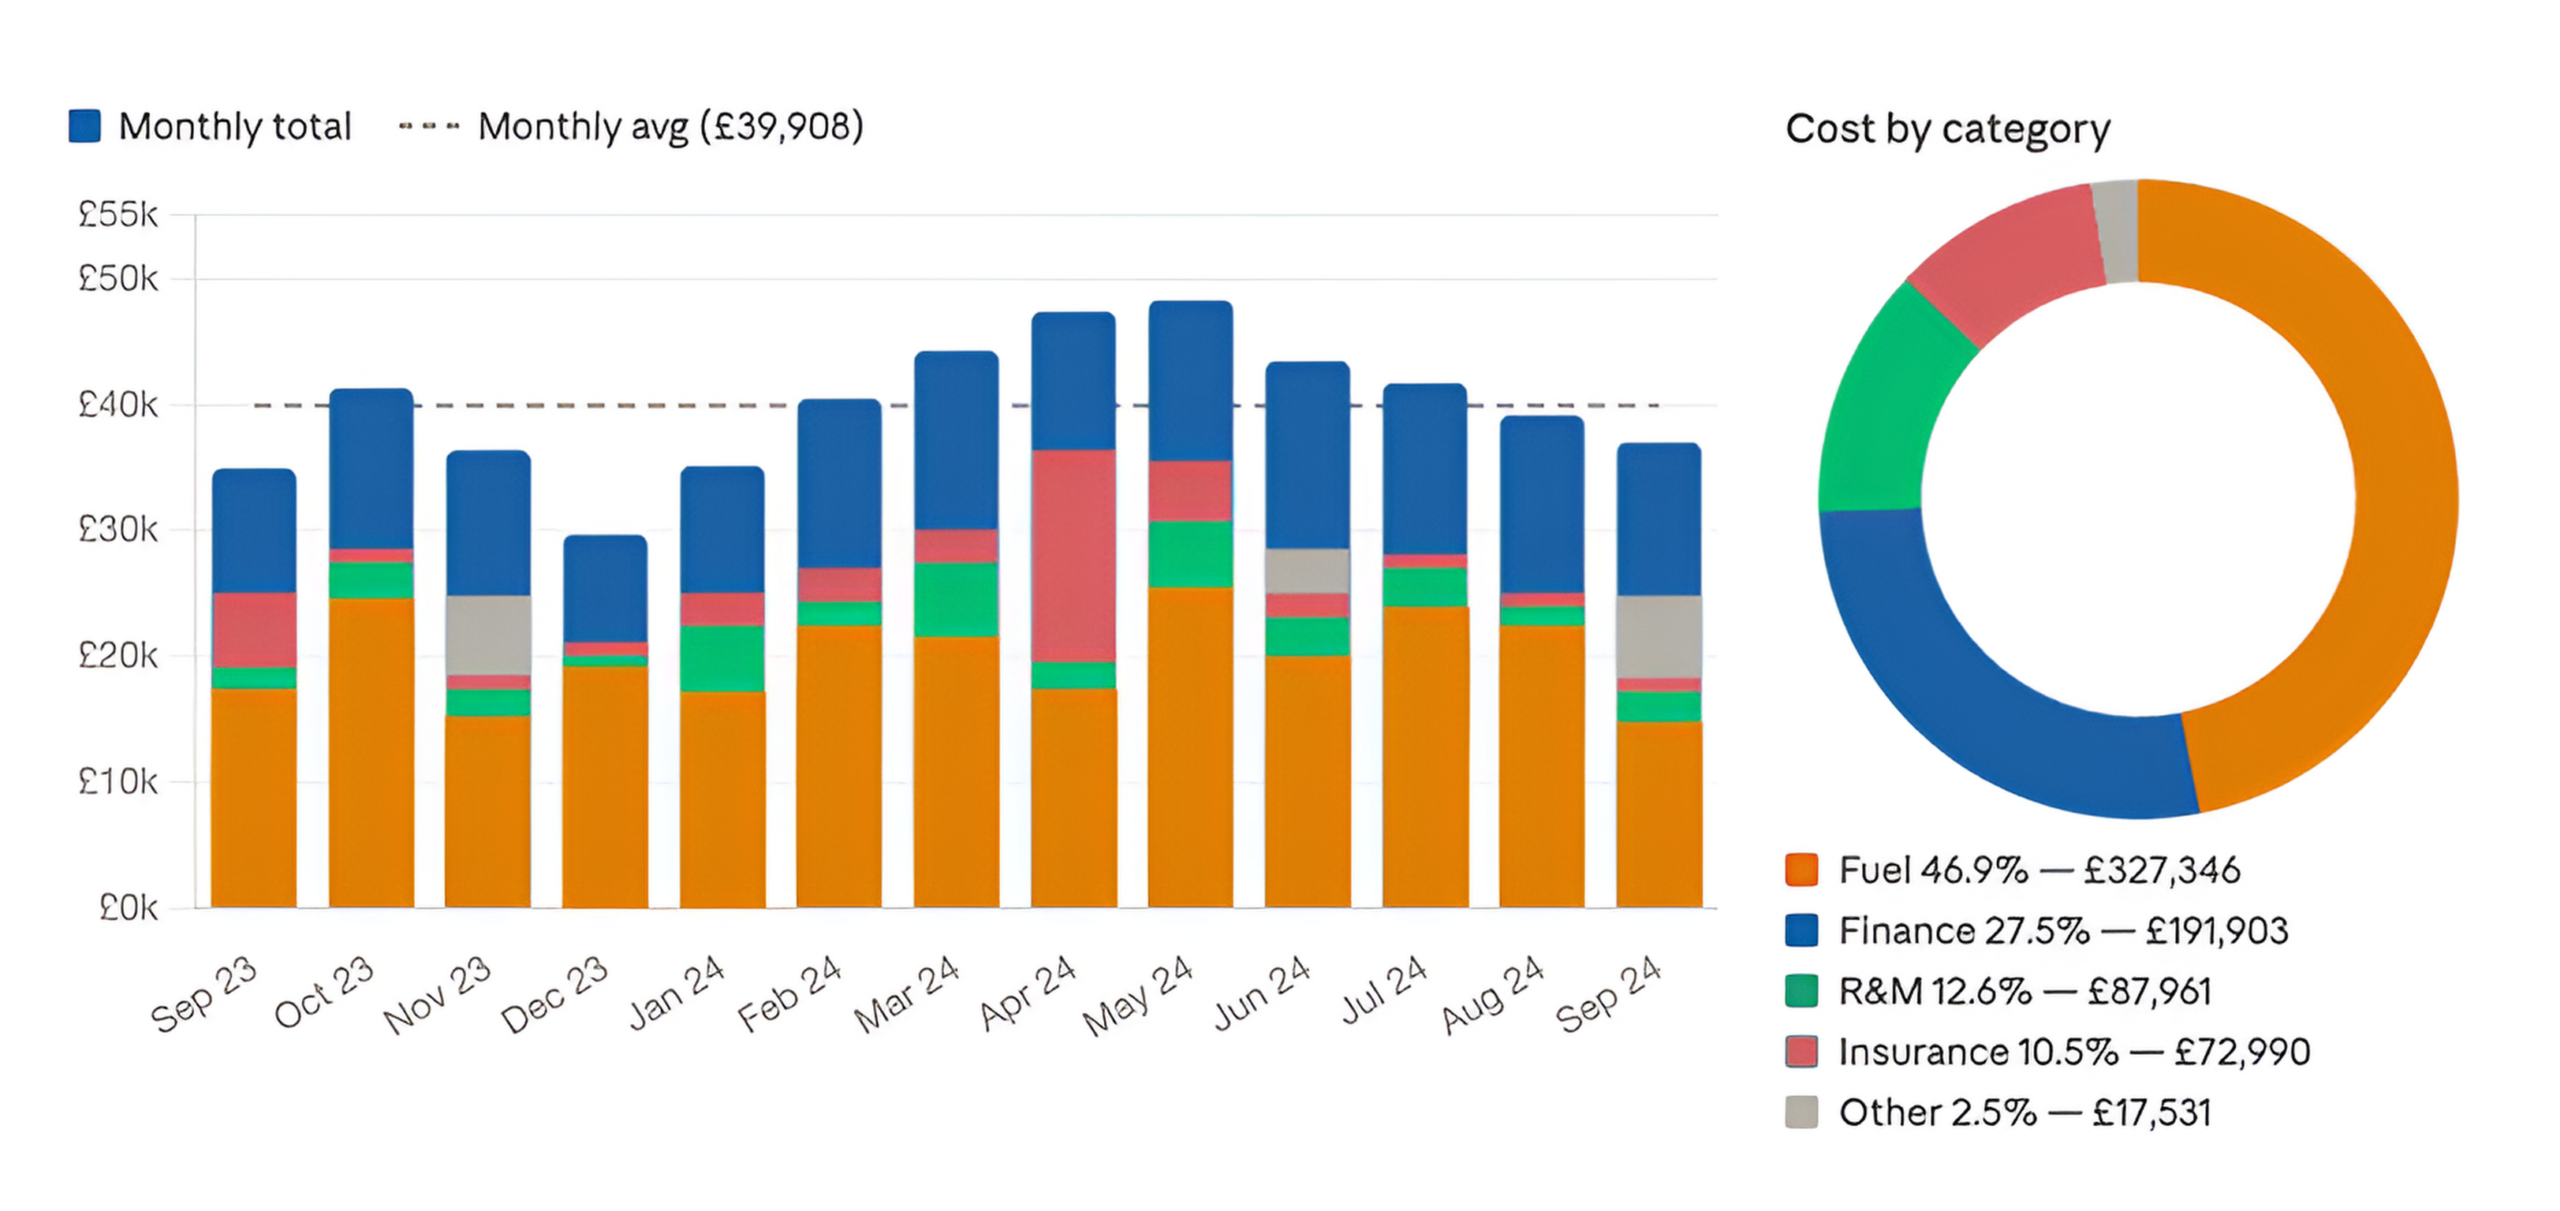
Keep board reports brief and use simple visual formats. A chart showing cost trend over twelve months communicates more quickly than a table of monthly figures. A traffic light grid of compliance status is more immediately readable than a narrative summary.
A well-constructed board report covers five areas.
1. Fleet cost summary
Total fleet cost for the period, compared to budget and the same period last year. Cost per vehicle, cost per mile if applicable. Brief narrative explaining any significant variance. This should be one number – total fleet cost – supported by a simple breakdown and a trend line.
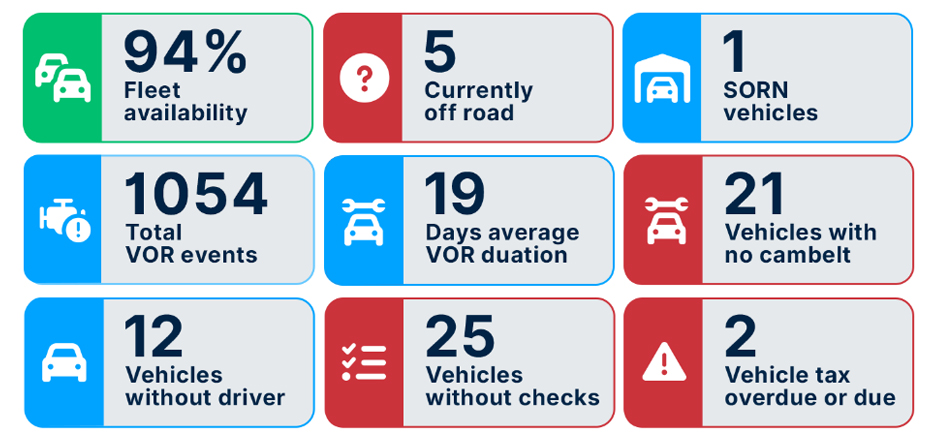
2. Fleet safety and compliance status
Boards do not need to know about individual licence checks; they do need to know whether the fleet has significant compliance exposure. A high-level overview of key safety metrics, displayed on a single fleet dashboard showing RAG (red, amber, green) status works well here. The information should include:
- Incident rate compared to previous periods
- Any serious incidents in the period with brief commentary
- A compliance summary showing the proportion of vehicles and drivers fully compliant against key obligations
3. Significant risks and actions
Boards cannot act on risk they cannot see. Any issues that represent material risk to the business such as an increase in at-fault incidents that may affect insurance renewal, a compliance gap that needs investment, a vehicle replacement programme that is overdue. These should be stated clearly with the proposed response and cost.
4. Fleet performance against targets
Key performance indicators relevant to the board include availability rate, utilisation, cost per mile trend and fuel efficiency trend – all compared against targets set at the start of the year. Keep to four or five metrics, clearly displayed.
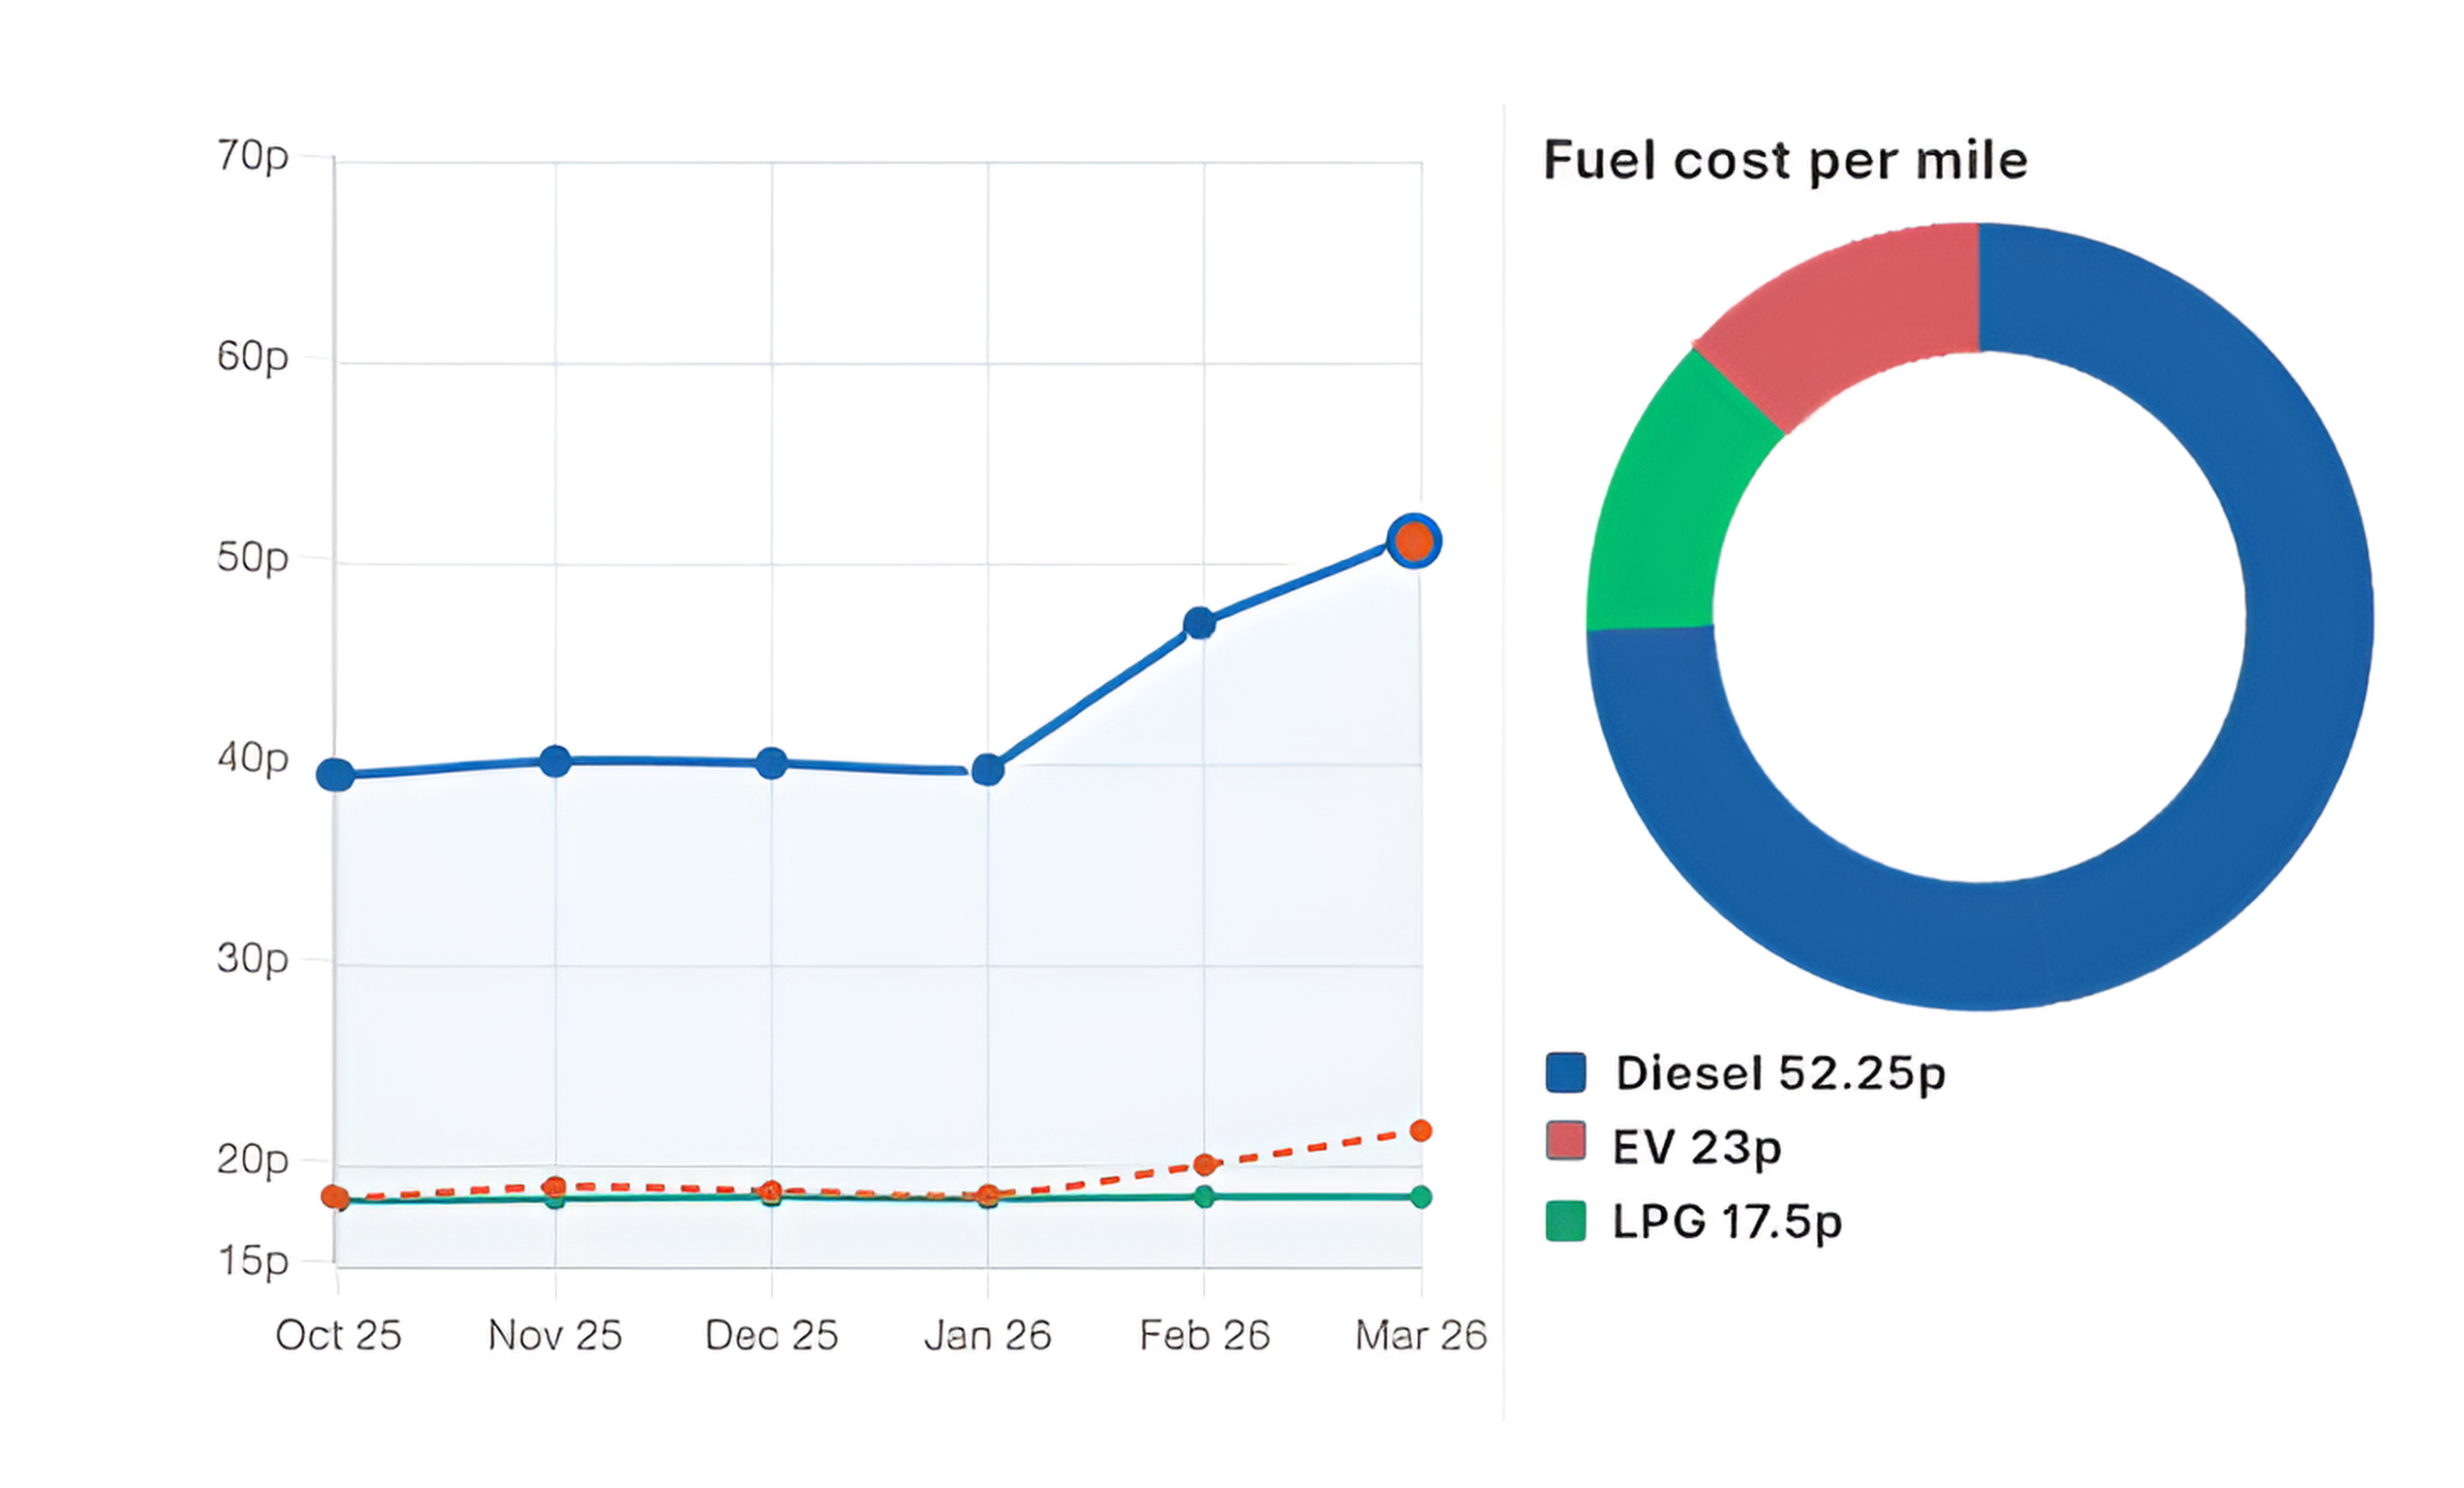
Cost per mile trend October 2025 – March 2026
5. Forward look
What is coming in the next quarter that the board should be aware of? Any major renewals, planned procurement decisions, regulatory changes that will affect fleet operations or cost? This positions the fleet manager as someone who manages proactively, not reactively.
How to improve board interest and engagement
Even well-constructed fleet reports can fail to generate board engagement if they're not framed in the right way. Boards respond to risk and financial impact.
The most effective shift is translating fleet metrics into business outcomes
Don't report that the incident rate is 4.2 per million miles – report that work-related vehicle incidents cost the business an estimated £X in management time, vehicle repair, insurance excess, and lost productivity last year, and that the trend is moving in a direction that will affect next year's insurance renewal. One framing is an operational statistic. The other is a business problem.
Benchmarking adds credibility
Reporting your fuel cost per mile in isolation tells a board nothing. Reporting that it is 12% above industry average for your vehicle type, with a specific driver behaviour programme identified to close the gap, is a statement that demonstrates both expertise and accountability.
Connect fleet performance to corporate objectives
If the business has sustainability commitments, fleet carbon reporting belongs in the board pack. If the business is growing and vehicle capacity is a constraint, fleet planning data belongs in board discussions about operational capability. Boards engage when fleet data speaks to the things they already care about.
Don’t just provide information – ask for decisions
Board reports that end without a clear call to action tend to generate passive acknowledgement rather than active engagement. Structure your board reporting so that the items requiring board awareness are clearly separated from the items requiring board decision. Give boards something to do with the information.
Consistency builds trust over time
A board that receives the same clear, well-structured fleet report every quarter, with metrics that are tracked over time rather than reported in isolation, develops a sense of the fleet's trajectory. They start to notice trends, ask better questions, and engage more substantively. Irregular or inconsistent reporting, by contrast, keeps the board at arm's length from fleet performance.
Immediate steps to improve your reporting
If your current fleet reporting is inconsistent, incomplete or not reaching the right people, the path to improvement doesn't have to be complex. Here are five things you can do now.
- Audit what you currently report and what you don't
Map out every data source available to you – fuel cards, telematics, maintenance records, incident logs, licence checks, etc. – and identify which of the four reporting categories (safety, performance, efficiency, costs) each one feeds. The gaps that emerge from this exercise tell you where your reporting blind spots are.
- Establish a baseline for your key metrics
Before you can track trends, you need a starting point. Pick the ten metrics that matter most to your operation and establish current values. Even if the numbers aren't good, knowing where you stand is more useful than not knowing.
- Agree a reporting rhythm
Operational safety and performance data should be reviewed weekly. Fleet management reporting should be produced monthly. Board-level reporting should be quarterly. Build this rhythm into your calendar and protect it – reporting that happens irregularly tends to happen poorly.
- Standardise your formats
Reports produced differently each period make trend analysis harder and take longer to produce. Build standard templates for each reporting level and use them consistently. Fleet management software significantly reduces the time this takes by automating data extraction and report generation.
- Identify your board audience and adapt your language
Talk to your finance director or CEO about what fleet information would be most useful to them. You may discover that what they want is simpler than what you've been producing, or that there are specific areas, such as insurance costs, emissions, or vehicle investment decisions, where they want more visibility than they're currently getting. Reporting works best when it's designed around the audience, not the data.
Conclusion
Fleet management reporting is one of the highest-value investments a fleet manager can make. The data is usually already there in fuel cards, telematics systems, maintenance records, and driver checks. The opportunity is in connecting it, structuring it, and presenting it in a way that drives decisions rather than simply describing activity.
Fleets that report well protect themselves legally, manage costs more effectively, and earn genuine credibility with the wider business. Fleet managers who report well protect themselves professionally, develop their strategic influence, and build the kind of track record that gets investment approved and careers advanced.
The data tells the story. Good reporting helps you make sure the right people hear it.